Skip to content
POINTCAST ↗OBJECT LIBRARY ↗SOURCES ↓

EL SEGUNDO / 25 MILES / A LIVING ATLAS

A year
within reach.

The ocean changes the afternoon.
The hills change the wind.
A few good objects change the day.

Read the past. Make a seasonal plan. Keep space for what the weather does next.

Find your seasonal rhythm ↓
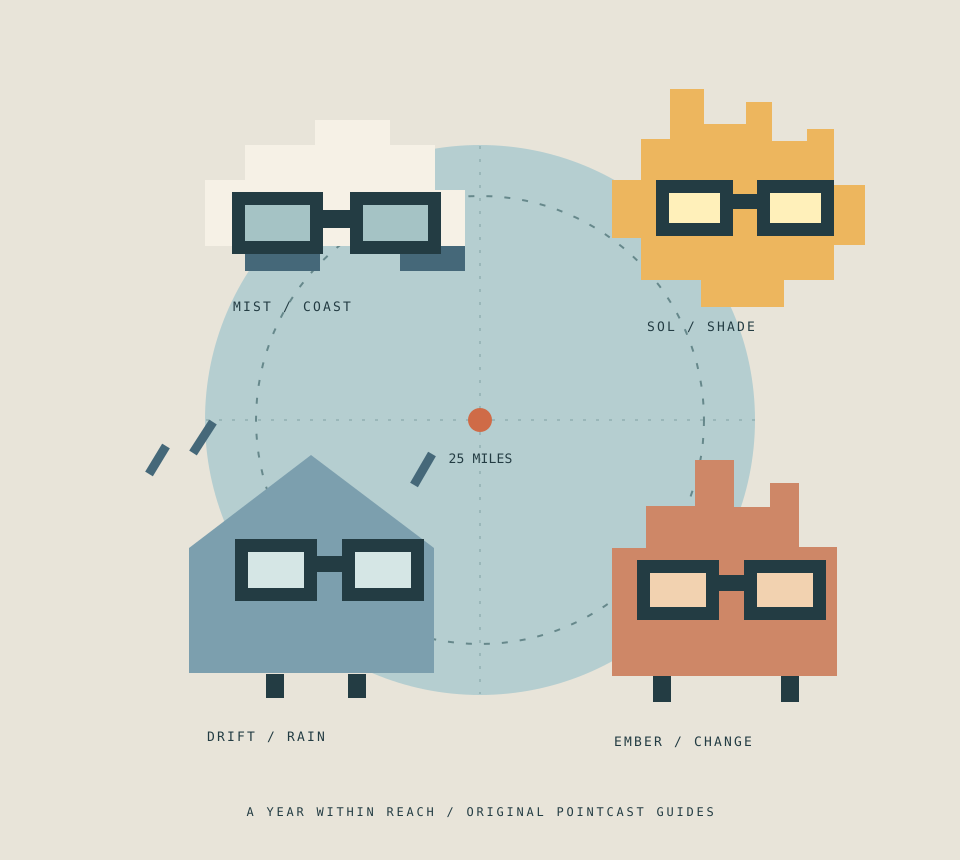
Original square-glasses guides: a marine cloud, a sun, a rain shell and an ember, arranged around a 25-mile circle
FOUR ORIGINAL GUIDES / ONE SHARED YEAR
HISTORICAL CLIMATE + PLANNING IDEAS

1991–2020 normals, dated station history and qualitative microclimates. This is an editorial atlas, not a live forecast, air-quality map or promise of comfort. No real objects are available to borrow.

01 / THE SEASONAL SUITABILITY MAP

Choose a rhythm.
Then check the day.

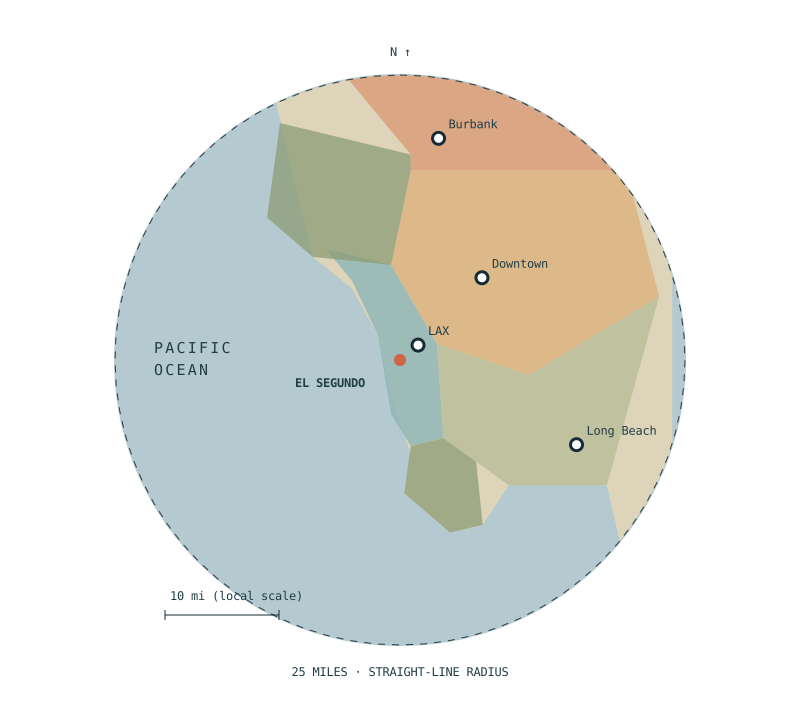
“Best” depends on your body, route, home and purpose. These are useful starting choices, not a ranked neighborhood recommendation. Map shapes are illustrative; station dots mark evidence.

Season
What matters today?
Illustrative microclimates inside a 25-mile radiusEl Segundo is the center. Ocean lies west, inland basin northeast, South Bay southeast, hills south and north, Burbank near the northern edge. Use the labeled buttons below for equivalent zone selection. Shapes are schematic, not measured contours. Ocean edge Inland basin South Bay and port plain Hills and exposed slopes: qualitative terrain class, sparse observations Northern inland edge PACIFICOCEANN ↑25 MILES · STRAIGHT-LINE RADIUS LAXDowntownBurbankLong BeachEL SEGUNDO10 mi (local scale)
Radius sampled with a great-circle formula. Coastline and zone boundaries are schematic. No gridded weather values were estimated between station dots. Read the method ↓

All named examples are inside the chosen circle except where a larger regional terrain is explicitly clipped to the circle. This is a distance boundary, not driving distance, a municipal boundary or a service area.

Summer · JUN — AUG

Bring shade into the plan.

Rain is normally scarce; inland afternoons are warmer than the immediate coast. Morning low cloud may offer a gentler start, but coastal cooling can fail during heat events.


Ocean edge

El Segundo · Manhattan Beach · Santa Monica

Cooler typical summer afternoons, onshore breeze, low cloud and salt exposure. Marine influence varies by day and distance from the water.

YOUR STARTING PLAN

Favor earlier or later outdoor time, shade and access to water; check heat alerts. Comfort is individual and cloud cover is variable.

Start with a layered coastal walk; use wind, cloud and current heat conditions to choose the hour.

LAX is the main numeric coastal anchor here. Beaches, street canyons and bluffs are not measured by the airport thermometer.

A useful object kit

  • BRIM · shade reminder
  • PANE · window cue
  • TURN · focus / pause

Design concepts only. No object here is safety equipment, a calibrated sensor or a forecast device.

Rehearse a library visit ↗
Summer, ocean edge, outdoor time.

02 / THE REPEATING SHAPE · NOAA 1991–2020

The coast keeps
a different clock.

Normals are 30-year reference statistics, not the most common day, a forecast or evidence that every year is the same. Four stations reveal contrast; they leave gaps across hills and neighborhoods. Source quality flags may include estimated months.

Normal daily maximum temperature · °F

Four station monthly normal high-temperature curves. Full values appear in the table below.50°60°70°80°90°JFMAMJJASOND
LAXDowntownBurbankLong Beach

LAX normal precipitation · inches / month

LAX rainfall concentrates in the cool season. Full monthly values appear below.01234JFMAMJJASOND
Rain is episodic. An annual sum hides dry stretches, intense storms and year-to-year variation.
Monthly station normals · °F and inches · 1991–2020. Values transcribed from NOAA CSVs; not live readings.
MonthLAX
high °F
Downtown
high °F
Burbank
high °F
Long Beach
high °F
LAX
low °F
LAX
rain in
Downtown
rain in
Jan66.368.067.067.449.42.863.29
Feb65.668.066.866.850.12.993.64
Mar66.169.969.568.652.21.732.23
Apr68.172.472.771.454.20.600.69
May69.573.775.573.157.60.280.32
Jun72.077.280.376.160.90.080.09
Jul75.182.086.781.464.00.040.02
Aug76.784.088.983.264.80.000.00
Sep76.583.086.682.463.70.110.13
Oct74.478.679.477.759.80.490.58
Nov70.972.972.572.553.70.820.78
Dec66.167.466.166.749.12.232.48

USW00023174

LAX · coast

Airport metadata reaches 1930; supplied daily elements begin August 1944. Airport exposure is a coastal reference, not a beach or home measurement.

33.9381°N / 118.3889°W · 29.6 m · 2.0 mi from center

NOAA variable-specific flags: High (TMAX): S, 26–27 available years; Low (TMIN): S, 27–29 available years; Mean (TAVG): S, 26–27 available years; Rain: S, 30–30 years. S = Standard; R = Representative. Missing months may be estimated.

NOAA monthly source CSV ↗

USW00093134

Downtown / USC · historical series

Downtown climate series began in 1877. Civic Center observations moved to USC in 1999 and to FHMC in 2024. Normal is a composite historical series.

34.0236°N / 118.2911°W · 54.6 m · 10.2 mi from center

NOAA variable-specific flags: High (TMAX): S, 26–28 available years; Low (TMIN): S, 25–27 available years; Mean (TAVG): R/S, 25–27 available years; Rain: S, 30–30 years. S = Standard; R = Representative. Missing months may be estimated.

NOAA monthly source CSV ↗

USW00023152

Burbank airport · inland valley

Airport history metadata reaches 1931; supplied GHCNd daily elements begin in May 1998. NOAA temperature normal is Representative, with estimated missing months.

34.2006°N / 118.3575°W · 225.9 m · 19.7 mi from center

NOAA variable-specific flags: High (TMAX): R, 20–21 available years; Low (TMIN): R, 18–20 available years; Mean (TAVG): R, 18–20 available years; Rain: R, 20–23 years. S = Standard; R = Representative. Missing months may be estimated.

NOAA monthly source CSV ↗

USW00023129

Long Beach airport · coastal plain

Airport metadata reaches 1930; supplied daily elements begin January 1949. Coastal-plain airport is inland from the waterfront.

33.8117°N / 118.1464°W · 9.4 m · 17.2 mi from center

NOAA variable-specific flags: High (TMAX): S, 24–26 available years; Low (TMIN): R, 22–23 available years; Mean (TAVG): R, 22–23 available years; Rain: S, 29–30 years. S = Standard; R = Representative. Missing months may be estimated.

NOAA monthly source CSV ↗

Downtown is a station series with location changes, including Civic Center → USC in 1999 → Frank Hotchkin Memorial Training Center in 2024. The 1991–2020 normal spans earlier sites; the map uses an approximate USC anchor for orientation, not the current 2024 site. The NOAA monthly CSV retains older location metadata. Station-history evidence below.

03 / THE PAST IS NOT ONE WEATHER YEAR

A normal.
An exception.
A changing baseline.

Keep four kinds of evidence apart. An observed storm does not establish a trend. A statewide trend does not resolve a street. A future scenario is conditional on assumptions.

OBSERVATIONS / 1991–2025

The wet years and the dry ones

Complete GHCNd calendar-year rain sums at LAX include about 27.1 inches in 1998, 3.6 in 2013 and 25.4 in 2023. Those are specific observed years, not future odds. Compare the full 35-year record below.

NOAA LAX daily archive ↗

NORMAL / 1991–2020

A long dry season

LAX’s rounded monthly normals sum to 12.23 inches annually; approximately 87% is in November–March. Downtown’s sum is 14.25 inches. Year-to-year totals and timing vary substantially.

NOAA LAX monthly normal ↗

TREND CONTEXT / STATE / THROUGH 2020

A warmer California

NOAA’s 2022 state assessment reports nearly 3°F of statewide warming since the early twentieth century. It reports large precipitation variability. This is regional context; we have not estimated an El Segundo warming rate.

NOAA state assessment ↗

SCENARIO / FUTURE / CONDITIONAL

Keep the plan adaptable

The same assessment’s future warming and drought discussion depends on emissions pathways and model assumptions. This atlas uses that as a reason to keep shade, water and indoor alternatives in the plan; no future local values are forecast here.

NOAA scenario context ↗

OBSERVED HISTORY / 35 COMPLETE CALENDAR YEARS

The same place.
Different years.

NOAA GHCN-Daily accepted precipitation values, aggregated January–December, 1991–2025. These are observations, separate from the climate normal. No recurrence probability is implied.

LAX observed calendar-year rainfall · inches

LAX annual observed rainfall, 1991 to 2025, varies substantially. Full values and coverage are in the expandable table below.010203019911998200520132020202512.23in normal annual sum
All 365 or 366 calendar days had accepted precipitation values for each displayed year. Trace measured rain is retained as zero. Source records can be revised. Converted daily sums are shown to one decimal; small differences from official annual reports can reflect rounding.
Read the 35-year observation table and heat context ↓
NOAA raw daily aggregation · “90°F days” counts accepted daily maximums rounded to whole Fahrenheit before the ≥90°F threshold. Station exposure and downtown site moves limit comparisons.
YearLAX rain inDowntown rain inLAX 90°F daysDowntown 90°F daysLAX temp daysDowntown temp days
199111.115.1315365/365365/365
199216.622.7335366/366366/366
199320.723.5219365/365365/365
19948.18.7636365/365365/365
199523.323.7343365/365365/365
199616.117.8727366/366366/366
199712.010.7939365/365365/365
199827.127.9329365/365365/365
19996.98.1416365/365365/365
200011.011.9118366/366366/366
200117.019.605365/365365/365
20025.07.4011365/365365/365
20039.613.4219365/365365/365
200416.320.1621366/366366/366
200518.826.65—365/365364/365
20069.211.6341365/365365/365
20074.95.7—21364/365365/365
200811.014.41127366/366366/366
20097.59.4527365/365365/365
201020.123.1425365/365365/365
20119.912.3112365/365365/365
20128.98.2330366/366366/366
20133.63.6518365/365365/365
20148.39.8832365/365365/365
20156.07.7738365/365365/365
201610.311.8—25365/366366/366
201712.313.31231365/365365/365
20187.88.9425365/365365/365
201918.721.61127365/365365/365
20209.09.8—41365/366366/366
202112.114.3214365/365365/365
20226.47.2—19364/365365/365
202325.429.4117365/365365/365
202415.919.1224366/366366/366
202513.219.8130365/365365/365

An em dash means incomplete temperature coverage, not zero hot days. Blank NOAA quality flags and nonmissing values only. Downtown’s 2024 record spans its USC → FHMC move; these raw counts are not a homogenized trend. NOAA traces do not become positive rain amounts. Download complete observations and coverage CSV ↓

A change in normals is a different question

NOAA’s consistent-version comparison gives LAX’s August normal daily high as 75.7°F for recomputed 1981–2010, versus 76.7°F for 1991–2020: +1.0°F. Downtown’s corresponding values are 82.8°F and 84.0°F: +1.2°F. Those overlapping windows share 20 years; this is a baseline comparison, not an annual warming rate or an attribution study.

Use NOAA’s recomputed comparison files, rather than subtracting two separately released editions with different homogenization. Full comparison rows and source provenance are in the evidence download.

04 / THE ANNUAL LIVING CALENDAR

Less fighting the year.
More moving with it.

A repeating routine with room for exceptions. These are planning ideas derived from the climate shape; use current warnings, local rules and personal needs to decide the day.

DEC — FEB / DRIFT

Winter

Most rainfall arrives in the cool half of the year. Plan an outdoor window, a dry return and an indoor alternative. A wet year and a dry year can have very different rhythms.

Outdoor time
Choose a dry daylight interval and paved routes after rain; check closures, surf and NWS warnings before leaving.
Comfort & shade
Keep a removable layer near the door. Cool evenings can matter even when the afternoon feels mild.
Home & ventilation
Repair drafts and leaks; ventilate briefly when outdoor air is clean and conditions allow. Keep runoff paths clear.
Water & gear
Pause irrigation after meaningful rain according to your site and local rules; dry winters still require care.
SHELL ↗GLOW ↗PIP ↗

MAR — MAY / MIST

Spring

Rain tapers while the marine layer becomes a familiar coastal visitor. Overcast does not promise cool conditions everywhere: a few miles inland or an exposed slope can tell another story.

Outdoor time
Try a late-morning coastal outing if low cloud persists; choose shade when inland sun arrives. Check the actual cloud and wind first.
Comfort & shade
Pack one light layer instead of betting on the first look outside. Wind and exposure change comfort.
Home & ventilation
Use a simple indoor/outdoor temperature check before opening windows. Air quality and noise also count.
Water & gear
Review soil moisture and plant needs before adding summer irrigation; use mulch and repair drips.
PANE ↗TURN ↗PIP ↗

JUN — AUG / SOL

Summer

Rain is normally scarce; inland afternoons are warmer than the immediate coast. Morning low cloud may offer a gentler start, but coastal cooling can fail during heat events.

Outdoor time
Favor earlier or later outdoor time, shade and access to water; check heat alerts. Comfort is individual and cloud cover is variable.
Comfort & shade
Shade sun-facing windows before heat accumulates. A timer can remind you to stop and recheck conditions.
Home & ventilation
Ventilate only when outside is cooler and air is clean; during smoke use official AirNow guidance. A window cue is not an air-quality sensor.
Water & gear
Use local watering rules, efficient irrigation and drought-tolerant planting. The normal dry season is not a drought declaration.
BRIM ↗PANE ↗TURN ↗

SEP — NOV / EMBER

Autumn

Early autumn can remain hot. Offshore Santa Ana episodes can bring warm, dry, gusty air; later autumn begins the transition toward rain. Smoke can occur in any season.

Outdoor time
Check heat, fire-weather, wind and smoke notices before an exposed walk. Swap the plan for a sheltered indoor activity when conditions worsen.
Comfort & shade
Keep shade gear ready in September, then restore the rain kit as winter approaches. Calendar dates do not define the weather.
Home & ventilation
Keep a clean-air room plan and check filters. Shut windows during smoke; follow AirNow and local official instructions.
Water & gear
Inspect gutters and runoff before the first storm; keep water conservation habits through warm spells.
PANE ↗SHELL ↗GLOW ↗

Before choosing today

NWS Los Angeles / Oxnard forecasts and alerts · AirNow current air quality · NWS heat guidance · AirNow smoke guidance · California drought information

This page does not fetch or display current conditions. An object cue cannot replace an alert, smoke monitor or cooling plan.

05 / HOW PEOPLE MIGHT HAVE MAPPED IT

From a station notebook
to a layered map.

Historical methods often answer different questions than a modern comfort map. A useful map carries its evidence and its missing pieces.

01

A weather day, plotted

Beginning in 1871, daily weather maps assembled station readings into a wider pattern: pressure, rain and temperature. They help place an unusual day in context. A 2000 NWS regional guide plotted local reference stations and illustrated an August 1999 inversion.

A dated synoptic map describes that observation time. It is not a neighborhood comfort map or an event-frequency estimate.

NOAA/WPC archive ↗
02

The landscape underneath

USGS historic topographic maps (printed editions 1884–2006) supply contours, waterways and settlement. Hills, slope and ocean exposure help interpret why nearby stations differ. Compare dated editions carefully.

Contours show elevation. Historic maps need their edition, datum and georeferencing before an overlay; we did not digitize a local historic sheet here.

USGS map collection ↗
03

A model between stations

Modern PRISM normals estimate a climate surface using observations, elevation and other physical relationships. Its current 1991–2020 products have 800 m and 4 km grids. A seasonal suitability map then adds a clearly labeled purpose.

No PRISM cells are shown here. Current map zones are illustrative terrain classes, not interpolated observations. A quantitative next edition requires documented processing and validation.

PRISM data and methods ↗

What this edition actually does

25 statute miles = 40.2336 km, great-circle (haversine), Earth radius 6,371.0088 km. The on-screen local equirectangular projection uses the center latitude; the boundary is sampled geodesically. Neighborhood shapes and coastline are schematic editorial illustrations, not GIS boundaries or measured weather interpolation.

It compares four station normals and builds a qualitative coast / basin / South Bay / hills / northern-edge model. Colors describe terrain and marine influence, not measured temperature. No pixel receives an interpolated value; advice changes by season and purpose. A later quantitative layer would need station QC, elevation and ocean exposure covariates, cross-validation and uncertainty intervals.

We did not calculate a local warming trend, attribution result, future temperature forecast, rain probability or optimized route. We did not survey shade, individual homes, trail conditions or air pollution. Coastal and hill coverage is sparse; microclimates can shift with wind and marine-layer depth.

06 / KEEP THE FIELD NOTES

A map is a question
you can carry.

Revisit each season. Notice what your block does. Bring the observation back to a future object prototype.

Research + product briefs ↓Complete reproducible research kit · ZIP ↓Monthly normals · CSV ↓Illustrative field map · SVG ↓Machine edition ↗

Downloads include source periods and caveats. Original illustrations reference the open Nouns visual culture, with no imported token art and no official affiliation.

07 / SOURCE APPENDIX

Useful things
need an honest trail.

Research accessed 2 October 2026. Government sources and original station files anchor the numeric claims; editorial advice is labeled as inference.

  1. NOAA U.S. Climate Normals / periods, quality and comparison method ↗

    Defines station normals, available-year flags and consistent-version comparison cautions. Four raw monthly station CSVs are linked above and downloadable below.

  2. NWS Downtown Los Angeles observing-site move notice ↗

    Series began July 1877; Civic Center 1964–1999, USC since 1999, relocation in May 2024. Moves limit direct site comparisons.

  3. NOAA Historical Observing Metadata Repository ↗

    Station coordinates, elevations and histories. The historical USC anchor differs from coordinates retained in the monthly normals CSV.

  4. NOAA GHCN-Daily station data and quality flags ↗

    Daily records were aggregated for complete calendar years 1991–2025 at LAX and Downtown. Nonmissing values with blank quality flag only; trace measured rain retained as zero. Daily file links are included in downloads.

  5. NOAA JetStream: Marine Layer ↗

    Explains inversion, variable depth, terrain reach and May Gray / June Gloom. Does not establish cloud hours on any atlas parcel.

  6. NWS Los Angeles: Weather of Southern California, WR-261 (2000) ↗

    Historic regional interpretation: station-location map, August 1999 inversion and wind maps. Historic statistics and service guidance are not used as current warnings.

  7. NWS Mountain and Valley Winds ↗

    Santa Ana mechanism and September–May occurrence context. Offshore-wind checks apply beyond autumn.

  8. NOAA California State Climate Summary 2022 ↗

    Observations through 2020 show nearly 3°F statewide warming since the early twentieth century and major rainfall variability. State trend context and future emissions scenarios are separate from local station evidence.

  9. NOAA/WPC Daily Weather Map archive ↗

    Dated synoptic charts and historical 1871–2002 scans; these are weather snapshots, not porch-scale climatology.

  10. USGS Historical Topographic Maps ↗

    Preserves printed map editions from 1884–2006. Contours explain landscape; elevation lines are not measured weather boundaries.

  11. PRISM 1991–2020 normals ↗

    800 m and 4 km modeled climate grids. Linked as a future quantitative mapping option; no PRISM raster was processed for this edition.

  12. PRISM mapping methods ↗

    Models consider terrain, station information and coastal influence; modeled cell values still need uncertainty and validation.

  13. NWS During a Heat Wave ↗

    Basis for cooler activity periods, shade breaks and an indoor cooling alternative. Seasonal mean is not a heat-alert threshold.

  14. EPA Wildfires and Indoor Air Quality ↗

    Explains smoke entering homes and the limits of ventilation. Use current AirNow and official guidance.

  15. EPA Create a Clean Room ↗

    Source for clean-air room planning, commercial filtration and cooling tradeoffs. No library object is an air cleaner.

  16. NOAA NIDIS California drought information ↗

    Dated drought context and different water-system impacts. A normal dry season is not a drought declaration.

  17. NWS Flood Safety ↗

    Current storm guidance overrides seasonal route ideas. The atlas does not estimate route passability.

  18. Nouns visual culture ↗

    Inspiration for original square-glasses illustrations. No Nouns token assets or code imported. Independent art; no official Nouns affiliation.

POINTCAST / A YEAR WITHIN REACH
RESEARCH & DESIGN BY CODEX · 02 OCT 2026

Object Library ↗RADIUS field instrument ↗Back to PointCast ↗